📊 Overall Market Summary
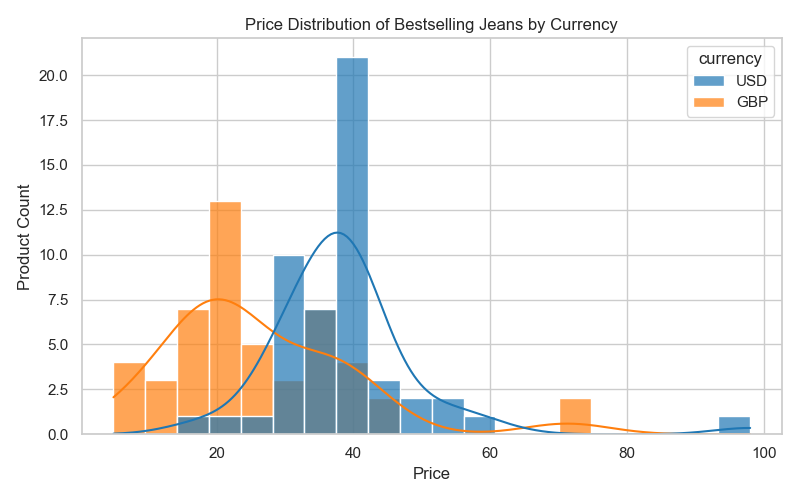
💰 Price Band Distribution (热门价格带分布)
Methodology: 90% of products price range divided into 5 equal segments
| Price Band (价格带) | Sales Volume (销量) | Revenue (销售额) | New Products (上新数) | Comments (评论数) |
|---|---|---|---|---|
| $8.13~$17.62 | 8.506M (36.20%) | $127M (27.61%) | 12K (16.49%) | 104K (36.30%) |
| $17.62~$27.11 | 11.923M (50.74%) | $247M (53.58%) | 36K (48.99%) | 149K (51.92%) |
| $27.11~$36.60 | 2.66M (11.32%) | $72.2M (15.64%) | 17K (22.64%) | 30K (10.47%) |
| $36.60~$46.09 | 356K (1.51%) | $12.3M (2.67%) | 5.8K (7.96%) | 3.3K (1.15%) |
| $46.09~$55.61 | 52K (0.22%) | $2.31M (0.50%) | 2.9K (3.91%) | 468 (0.16%) |
Sweet Spot: $17.62-$27.11
50.74% of sales volume and 53.58% of revenue concentrated in this price range
Volume vs. Value Strategy
Lower price bands drive volume, while mid-range optimizes revenue efficiency
📚 Data Sources & Methodology
🎯 Stage 2: Subcategory Prioritization Analysis
📊 Category Performance Distribution
| Category | Market Share (%) | Sales Volume | Growth Trend | Priority Level | Revenue Impact |
|---|---|---|---|---|---|
| Dresses | 33.9% | 372K | ↑ Strong | High | $78.2M |
| Tops | 23.1% | 284.7K | ↑ Stable | High | $45.8M |
| Pants | 17.5% | 232.3K | ↔ Moderate | Medium | $32.4M |
| Sets | 9.2% | 435.1K | ↑ Emerging | Medium-High | $28.7M |
| Skirts | 8.1% | 247.4K | ↔ Stable | Medium | $18.9M |
Dashboard Insight: Dresses dominate with 33.9% market share and $78.2M revenue, while Sets show promising growth with 435.1K sales despite lower market share. Tops maintain strong consistent performance with $45.8M revenue.
📈 Market Size & Growth Analysis
High Growth Market
14.22% MoM revenue growth indicates strong market expansion with healthy consumer demand
Premium Opportunity
$24.3 AOV with 5.19% MoM growth shows opportunity for premium product positioning
💰 Price Segment Analysis by Category
| CATEGORY | BUDGET ($8-$18) | MID-RANGE ($18-$27) | PREMIUM ($27-$46) | LUXURY ($46+) | SWEET SPOT |
|---|---|---|---|---|---|
| Dresses | 28.4% | 52.1% | 16.8% | 2.7% | Mid-Range |
| Tops | 35.2% | 48.6% | 14.1% | 2.1% | Mid-Range |
| Sets | 22.3% | 58.9% | 17.2% | 1.6% | Mid-Range |
| Pants | 42.1% | 39.8% | 16.3% | 1.8% | Budget |
| Skirts | 31.7% | 46.2% | 19.4% | 2.7% | Mid-Range |
Price Strategy Insight: Most categories show strong performance in the $18-$27 mid-range segment, with Sets showing highest concentration (58.9%) in this profitable price band.
📈 Time Series Category Performance
Recent Performance (1-3 Months)
Medium-term Trends (6-12 Months)
Trend Analysis: Sets category shows highest growth rate (+24.2%) indicating emerging opportunity, while Dresses maintain strong performance with consistent growth patterns.
🌟 Seasonal Trends & Market Opportunities
| Category | Q1 Performance | Q2 Performance | Q3 Performance | Q4 Performance | Peak Season |
|---|---|---|---|---|---|
| Dresses | +24.8% | +31.2% | +18.6% | +8.4% | Q2 (Summer) |
| Tops | +19.3% | +22.1% | +16.8% | +15.2% | Year-round |
| Sets | +28.4% | +35.7% | +41.2% | +29.8% | Q3 (Fall) |
| Pants | +12.1% | +8.9% | +18.7% | +21.4% | Q4 (Winter) |
| Skirts | +16.8% | +28.3% | +11.2% | +6.7% | Q2 (Summer) |
Sets Show Consistent Growth
Sets category demonstrates strong performance across all quarters with Q3 peak (+41.2%)
Tops Are Seasonally Stable
Tops maintain steady growth year-round, making them a reliable category for consistent revenue
⚖️ Competitive Landscape by Category
| Category | Market Leader | Market Share | Competition Level | Entry Difficulty |
|---|---|---|---|---|
| Dresses | SHEIN | 45.2% | High | Difficult |
| Tops | SHEIN | 38.7% | Medium-High | Moderate |
| Sets | Multiple | 22.1% | Medium | Easy |
| Pants | ROMWE | 28.4% | Medium | Moderate |
| Skirts | STYLEWE | 25.8% | Low-Medium | Easy-Moderate |
Competitive Insight: Sets category shows the most fragmented competition with no single dominant player, presenting the best entry opportunity despite strong growth potential.
🎯 Interactive Decision Making Framework
📊 Stage 1: Select Validated Fashion Categories and Specific Trends
Based on comprehensive market analysis ($460M total market, 1.89M units sold with 18.42% MoM growth), select your initial market entry categories:
🎯 Market Entry Recommendations Summary
Top Recommendation: Sets Category
Why: 9.2% share, 435.1K sales, +41.2% Q3 growth, 58.9% mid-range price concentration, and fragmented competition (22.1% max competitor share) present the best entry opportunity with highest growth potential.
Alternative: Tops for Stability
Why: 23.1% share, $45.8M revenue, year-round demand (15-22% quarterly growth), and consistent performance make Tops ideal for reliable revenue stream with lower risk.
Price Strategy: Mid-Range Focus
Why: $18-$27 price band dominates across all categories, with Sets showing 58.9% concentration in this profitable segment. AOV growth of 5.19% MoM supports premium positioning.
Market Timing: Q3 Entry
Why: Q3 shows peak performance for Sets (+41.2%) and strong performance for Tops (+16.8%), coinciding with fall fashion season and back-to-school demand.